Elasticity of the Demand Curve
Price elasticity of demand is a measurement of the change in the demand for a product as a result of a change in its price. If a price change creates a large change in demand, that is known as elastic demand. If a price change creates a small change in demand, that is an inelastic demand.
Both demand and supply curves show the relationship between price and the number of units demanded or supplied. Price elasticity is the ratio between the percentage change in the quantity demanded, , or supplied, , and the corresponding percent change in price.
Computing the Price Elasticity of Demand
Finding the price elasticity of demand requires that we first compute percentage changes in price and in quantity demanded. We calculate those changes between two points on a demand curve.
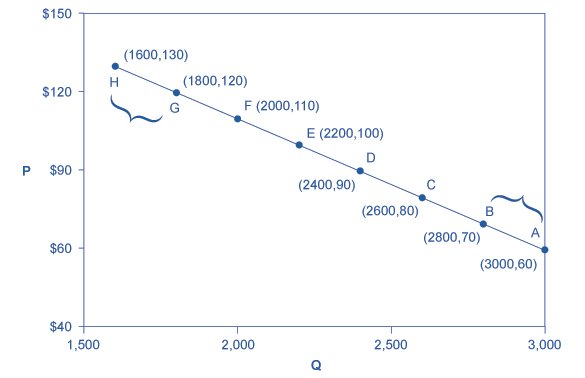
Let’s apply these formulas to a practice scenario. We’ll calculate the elasticity between points and in the graph below.

Relating Elasticity to Changes in Total Revenue
Consider the price elasticity of demand for gasoline. In the example above, 1,000 gallons of gasoline were purchased each day at a price of $4.00 per gallon; an increase in price to $4.25 per gallon reduced the quantity demanded to 950 gallons per day. We thus had an average quantity of 975 gallons per day and an average price of $4.125.
We can thus calculate the arc price elasticity of demand for gasoline:
Moving from point A to point B implies a reduction in price and an increase in the quantity demanded. Demand is elastic between these two points. Total revenue, shown by the areas of the rectangles drawn from points A and B to the origin, rises. When we move from point E to point F, which is in the inelastic region of the demand curve, total revenue falls.
A movement from point E to point F also shows a reduction in price and an increase in quantity demanded. This time, however, we are in an inelastic region of the demand curve. Total revenue now moves in the direction of the price change—it falls.
Notice that the rectangle drawn from point F is smaller in area than the rectangle drawn from point E, once again confirming our earlier calculation.
Conclusion
With above case study we have established a direct relation between price and demand. These results depend on the elasticity of the demand curve and on the price properties of each market.
This effect can potentially produce a kinked demand-curve where the kink lies at the point of the current price-level in the market.
Authored By: Professor J. Hamlin
Professor in the Department of Computer Science at the University of Warwick. I was previously a Turing Fellow at the Alan Turing Institute and a Royal Society Industry Fellow.